Ever feel like usual crypto charts might be skipping important hints? Experts are now watching wallet movements, transaction sizes, and even social chatter to catch shifts ahead of time.
It’s like hearing a soft whisper before a storm comes. This new method turns small on-chain signals into clear insights, helping you make smart moves when the market gets rocky. With these extra tools, you can spot hidden changes that ordinary data might miss and stay one step ahead in the fast-evolving world of crypto.
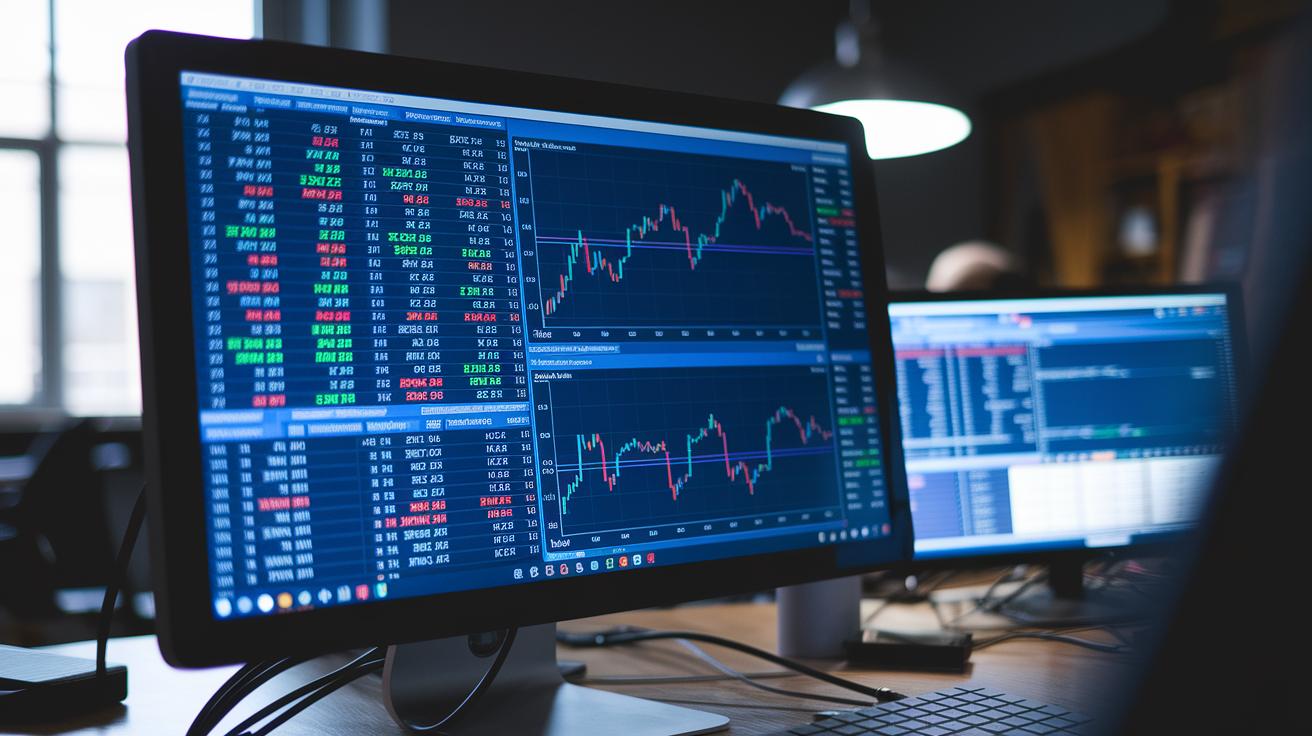
alternative crypto analysis strategies fuel fresh insights
Some crypto experts now use clues that aren’t part of the usual charts. They look at things like wallet addresses, how big a transaction is, token moves, social media chatter, and on-chain data (which means numbers tracked directly on the blockchain). Simply put, these details can show early signs of new coins or bubbles before regular price charts do. When the market gets rough, this extra information helps guide smart decisions.
Thinking about digital currency indicators in an unconventional way is like seeing hidden signals in a noisy room. For example, imagine a coin where, just before its price jumps, there’s a sudden increase in token activity and wallet addresses. It’s almost like a quiet whisper hinting at a storm to come. These little hints go way beyond what usual charts show.
Investors who lean into these techniques keep an eye on blockchain behavior and catch small changes that standard data might miss. They watch things like transaction counts and social media buzz to gauge risk and spot chances in real time. And if they notice something out of the ordinary, like a sudden surge in digital exchange activity, it could be a sign that the market is about to shift.
By mixing these digital clues together, crypto analysts build a powerful tool to understand a fast-changing market. Using these fresh strategies turns simple data points into clear and useful advice, even in uncertain times.
Leveraging On-Chain Signal Detection in Crypto

Have you ever wondered how raw blockchain data can turn into clear signals for predicting price moves? Platforms like Glassnode and ExtractAlpha make this possible. They take complicated numbers and turn them into easy insights, much like checking a heartbeat to see how healthy a network is.
Glassnode collects data right from the blockchain. It watches everyday activities such as transaction counts and miner behavior, basic clues that show the network’s overall health. Think of transaction counts as a pulse; when activity picks up quickly, it might mean the market is getting ready to change.
ExtractAlpha, on the other hand, keeps an eye on large wallet transactions, often known as whale moves. This platform also tracks token velocity, which is just a way to say “how fast tokens are traded.” A sudden jump in token velocity on a mature blockchain, for example, can be a hint of a coming price rise, almost like the quiet buzz before a storm.
Key factors here include the number of transactions, shifts in miner patterns, and the pace at which tokens change hands. Keeping track of these clues helps investors understand underlying market trends. In truth, by blending detailed blockchain data with continuous network reviews, crypto traders can spot emerging trends and tweak their strategies well ahead of major price shifts.
Applying Sentiment and Social Media Indicators to Crypto Analysis
When we talk about sentiment indicators, we're really looking at tools that gauge the mood of the market. They track things like tweet counts, sentiment scores, and mentions on sites like Reddit to get a feel for what's buzzing online. It’s a bit like eavesdropping on a lively conversation where rising cheers on Twitter might push prices up quickly, while more negative talks on forums could hint at upcoming sell-offs. For example, imagine a sudden flood of positive tweets about a coin sparking a rally, this early buzz often signals traders to pay attention before the official data confirms any trend.
Mixing these fresh sentiment measures with on-chain data gives us a clearer look at how investors are behaving. It’s similar to watching both sides of a coin to see the full picture. When social media engagement spikes alongside increased trading, it can offer a hint at what might come next. Still, online chatter can be unpredictable, and not every post has the same influence. That’s why many investors blend these quick-read signals with traditional data to build a more complete view of the market’s trends.
Integrating Machine Learning Portfolio Models in Crypto Analysis
Every day, automated systems carry out more than 200,000 trades using tried-and-tested algorithms that learn from past data. For instance, ExtractAlpha’s machine learning models manage $1.5 trillion in assets across the U.S., Europe, the Middle East, Africa, and Asia Pacific by shifting funds based on on-chain moves and signals from social media. Picture an algorithm that adjusts your trade positions the minute fresh market data comes in, like having a smart assistant who tweaks your portfolio as soon as it senses a change.
These models check out different trading strategies to see which one fits best with the current market vibe. One approach might rebalance quickly after a burst of strong momentum, while another waits for clear signs of risk. They compare these strategies and fine-tune the portfolio almost instantly, aiming to lower risk while boosting potential rewards.
Robo-advisors powered by these systems come with built-in risk controls that adapt continuously. They tweak asset allocations using models that update with every new piece of market info. Think of it like regular check-ups for your portfolio, making sure everything stays on track by catching soft market signals before they turn into full-blown changes.
If you’re curious about smart systems, check out more on AI investing at https://cipherreview.com?p=399. This method not only saves you time but also turns complicated technical breakdowns into simple ideas. By backtesting these models on historical data, they become even more accurate, giving you extra confidence in your trading decisions. Using machine learning portfolio models to mix live market signals into automated choices is quickly proving to be a practical way to manage crypto assets.
Contrasting Alternative Crypto Analysis with Traditional Technical Methods
Traditional crypto technical analysis depends on basic numbers like price, volume, and moving averages to sketch a clear picture of market behavior. Tools such as TradingView offer free charts and indicators that help you spot well-known trends and patterns, like noticing a breakout that hints at a change in direction. But these standard signals can sometimes miss early clues, like shifts in wallet addresses, changes in transaction sizes, or even the buzz on social media.
CoinMarketCap, for example, lets you track over 5,000 tokens using a simple interface. This makes it super easy for beginners to get a quick look at current market prices. On the flip side, alternative crypto analysis goes deeper. It picks up on gentle hints like shifts in market sentiment (a way to describe changes in investor mood) and the real movement of coins on the blockchain. By mixing traditional data with these nontraditional signals, investors can build a fuller picture that covers any blind spots. This blended method not only enriches your view of market trends but also creates a solid framework that adapts when technical indicators need tweaking.
Case Studies Showcasing Decentralized Asset Appraisal and Price Anomaly Detection in Crypto Analysis

Real-world examples show how decentralized asset appraisal and anomaly detection work in everyday scenarios. One fund kept an eye on a huge wallet swap of 10,000 ETH, and this single, massive move served like a bright signal, hinting at what was ahead, a 15% price drop eventually came into play. It was like hearing a loud alert before the storm hit.
Then there’s the study with ExtractAlpha. They used a cross-exchange arbitrage method, where they compared Bitcoin fork prices across different exchanges. Imagine spotting a small gap in a puzzle that quickly turned into a 2% profit opportunity. It’s a simple reminder that even a tiny price difference can lead to a neat gain.
Another interesting case came from watching Ethereum closely. When tokens began changing hands at a pace far quicker than usual, it raised a red flag about a possible bubble. It shows that even subtle changes in token movement can hint at bigger market trends down the road.
| Case Study | Indicator | Outcome |
|---|---|---|
| Wallet Swap Reminder | 10,000 ETH transfer | Warned of a 15% drop |
| Cross-Exchange Arbitrage | Price differences in Bitcoin forks | Reached a 2% gain |
| Token Movement Surge | Unusually fast token trades on Ethereum | Early hint of a bubble |
These cases clearly show how smart, decentralized analysis and watching for anomalies can unveil hidden trends in the crypto market.
Practical Implementation Guide for Alternative Crypto Analysis
When you start building your crypto analysis workflow, pick reliable data feeds first. Look at tools like Messari and Glassnode, they provide strong data on the basics of blockchain. Make sure your sources capture decentralized risk and track network fee trends accurately. Then, gather your data and clean it up. This cleaning, often called normalization, turns raw on-chain numbers into clear, useful signals.
Once your data is in order, add sentiment scores on top. In simple terms, this means matching social media chatter and transaction behavior to get a feel for the market mood. Use noise-filtering rules to cut out any distractions and focus on the real market moves.
After that, test your signals on historical data to see how they would have worked in the past. This backtesting step checks if your risk methods make sense and spots potential issues before going live. Try out different scenarios to fine-tune your strategy. Then, deploy your model using Python scripts or trusted portfolio platforms to automate risk control. Keep an eye on network fee trends and adjust your approach as market conditions change.
Remember to repeat this process regularly. By updating your data and models, you can catch new trends and keep your strategy strong and flexible over time.
Final Words
In the action, we journey through key concepts like digital currency indicators, on-chain signal detection, and sentiment analysis to spot crypto trends. We examined how machine learning and decentralized case studies provide fresh insights that challenge traditional technical methods. By blending classic tools with alternative crypto analysis strategies, investors gain a clearer view of the market. This mix of data-driven techniques and practical steps helps build a more confident approach to seizing emerging opportunities. It’s all about making smarter, informed choices moving forward.
FAQ
What are some effective alternative crypto analysis strategies?
Effective alternative crypto analysis strategies combine on-chain data like wallet flows and social sentiment from Reddit and other forums with unconventional metrics to spot emerging trends and market bubbles.
What are the best crypto analysis tools?
The best crypto analysis tools include charting platforms like TradingView and specialized services such as Glassnode, which aggregate on-chain data to help decipher market trends and digital asset movements.
What are some top crypto analysis websites?
Top crypto analysis websites deliver insights by merging fundamental data with on-chain and sentiment metrics, helping investors get a well-rounded view of market conditions for informed decision-making.
How do platforms like TradingView, Coinbase, Binance, Coinigy, Coinstats, and Bybit contribute to crypto analysis?
Platforms such as TradingView and Coinigy offer advanced charting and technical insights, while Coinbase, Binance, Coinstats, and Bybit provide essential market data and trading environments for comprehensive crypto analysis.

