Have you ever thought that a live crypto chart could boost your trading confidence? When Bitcoin hit $50,000, one trader noticed his chart flip from confusion to a clear sign, showing just how effective these tools can be. With real-time updates and simple visuals that turn raw numbers into clear insights, these charts make the complex world of crypto more friendly. In this piece, we'll chat about how interactive platforms and smart tools can power your trading moves and help you stay ahead in the market.
Real-Time Platforms for Crypto Trading Charts
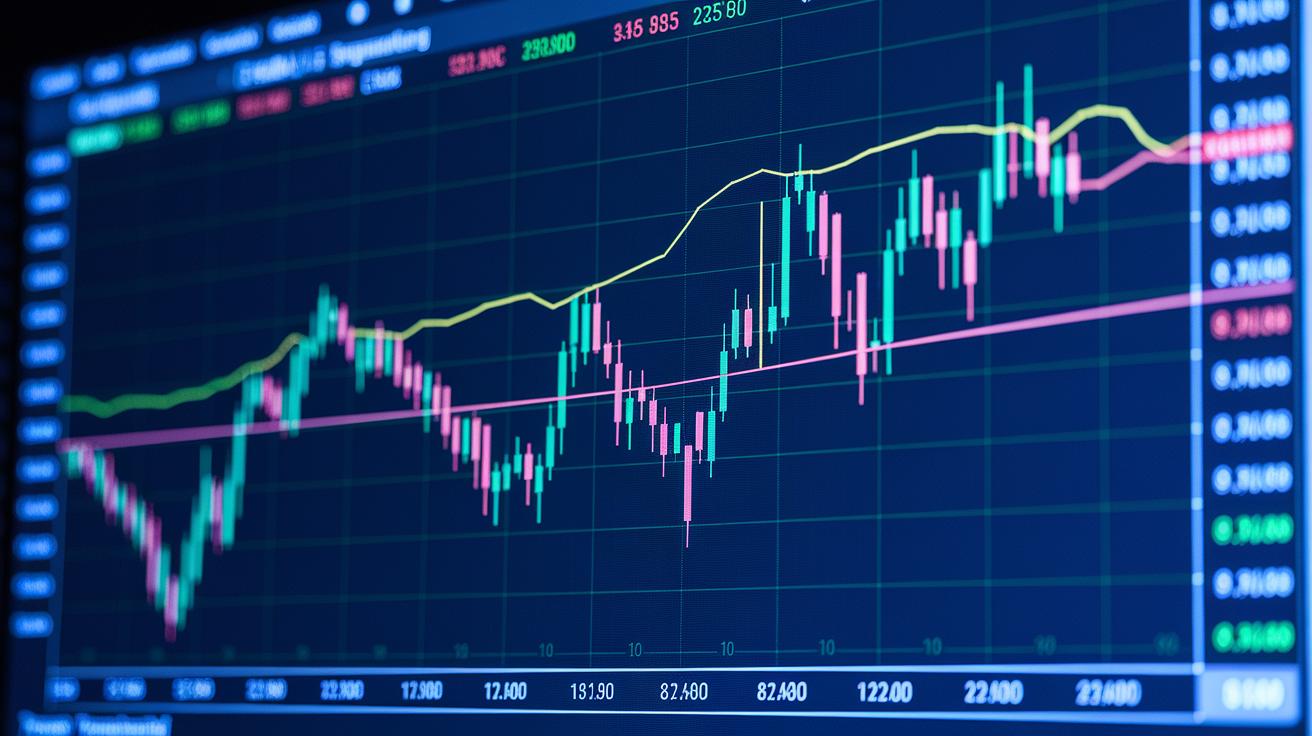
Interactive chart platforms give traders live updates that really matter when making quick decisions. Many crypto exchanges offer simple built-in charting tools that show basic real-time data, but more seasoned traders often lean towards advanced platforms like TradingView. One trader once mentioned that when Bitcoin hit $50,000, his chart refreshed instantly, turning uncertainty into a clear cue to act.
These platforms display up-to-the-second price shifts and market indicators, letting you see trends as they happen. Whether you’re a scalper looking for minute-to-minute details or a swing trader watching longer-term trends, real-time updates can cut through the guesswork by highlighting even tiny reversals and big breakouts.
Another cool feature is the rich library of overlays and drawing tools available. They let you mark support and resistance levels, spot pattern formations, and track moving averages, which means you can quickly turn raw data into useful insights. Ever notice how an interactive graph can reveal a gentle ripple before a massive wave hits?
Plus, many of these platforms connect with robust technical analysis software to deepen your market insights. With live updates, versatile charting tools, and customizable visuals, you’re well-equipped to navigate the ever-changing world of crypto trading.
Chart Basics for Crypto Trading Charts

Line charts give you a simple, clear look at the market. They quickly highlight trends like Bitcoin's price changes over the month. Imagine a line that slowly climbs to show steady growth or drops sharply when a downturn is coming. It's an easy way to see if prices are moving up or down.
Candlestick charts, on the other hand, tell a fuller story. They show four key points for each time period: the opening, highest, lowest, and closing prices. Think of each candlestick as a tiny narrative that not only reveals price moves but also hints at the market mood. It’s a bit like watching a sequence of snapshots from a fast-paced game.
Picking the right timeframe makes all the difference. A one-minute chart catches every little twist and turn, though it might include some extra detail you don't need. A daily chart, meanwhile, smooths things out so the bigger trends become clear. Using crypto graph apps and digital asset graphics lets traders easily visualize these trends and make decisions with confidence.
Technical Indicators Insights for Crypto Trading Charts
Moving averages form the heart of many trading strategies. They smooth out price data to help us see clear trends. For instance, comparing a 50-day simple moving average (SMA) to a 200-day SMA gives you a quick look at market momentum. When the 50-day SMA climbs above the 200-day SMA, that golden cross signals a possible move upward. But if the 50-day drops below the 200-day, a death cross might be coming, hinting at a slowdown. One trader once said, "Seeing that golden cross felt like catching a green light on a busy day."
Bollinger Bands add another layer to this picture. They use a 20-day moving average along with bands set two standard deviations apart, a way to measure price swings. If prices hit the upper band, the asset might be overbought. On the flip side, touching the lower band suggests it could be oversold. Think of Bollinger Bands as flexible boundaries that shift with the market’s rhythm.
Oscillators like RSI, MACD, and the Stochastic indicator convert price numbers into momentum scores. The RSI shows if an asset is overvalued or undervalued by comparing gains and losses. MACD looks at two moving averages to spot potential reversals, and the Stochastic tells you where the price sits in its high-low range. A sudden signal from any of these tools might be just the nudge needed to reassess your trading game.
| Indicator | Typical Setting |
|---|---|
| Simple Moving Average | 50-period and 200-period |
| Bollinger Bands | 20-period MA, ±2 standard deviations |
| RSI | 14-period |
Using these indicators together creates a fuller picture. It combines trend data with momentum insights, giving you more confidence with every trade.
Candlestick Pattern Guide in Crypto Trading Charts
Candlestick charts give you a clear picture of what’s happening in the market. Each candle shows the opening, high, low, and closing prices, which helps you feel the market's mood. Many traders watch these charts to spot signs that prices might turn or keep moving in the same direction.
Imagine a bullish engulfing pattern. Here, a small red candle (showing a drop in price) is quickly followed by a bigger green candle that completely covers it. This shows that buyers are taking charge and could be pushing the market upward. Now, think about a hammer formation. It has a short body with a long lower wick, almost like a tiny nail hammered into the chart. This can signal that buyers are stepping in after sellers pushed the price down.
Then there’s the doji. In this pattern, the opening and closing prices are nearly the same, which points to confusion or indecision among traders. This uncertainty often comes before a shift in the market direction. By checking out the size of the candle bodies, the wicks (the high and low parts), and the colors, you can catch subtle hints in the price action.
Remember, no pattern works on its own. Mixing these candlestick cues with the overall trend and volume data can give you a fuller, more reliable view. For example, seeing a bullish engulfing pattern in a rising market might confirm it’s a good time to jump in, while a doji during a steady trend might be a sign to hold back. These tools help you make smarter decisions about when to enter or exit your trades.
Volume Analysis Techniques for Crypto Trading Charts
Volume bars give you a clear view of how strong price movements really are. When you see a green bar, it means prices are rising and there’s strong buying interest; a red bar means prices are falling, often due to selling. For example, if you spot a sharp volume spike around $39,500 or $42,000, it usually confirms that a breakout is happening, which can boost your confidence in the upward move.
But keep in mind that volume can also help spot false breakouts. Imagine prices nearing $44,500 and you notice a sudden surge in volume, that might hint that the market is getting ready to reverse instead of continuing on its current path. Really, it’s like if you see a red volume bar as prices approach $42,000, it could mean sellers are jumping in, suggesting you take a moment to rethink your entry.
Traders often pair volume readings with price action to get a better sense of momentum. They might wonder, “Does this spike in volume match the price move?” When it does, it strengthens the trend; when it doesn’t, it might be a signal to be extra cautious.
- Look for volume spikes at key price levels as a cue to dive deeper into your analysis.
- Compare what the volume data says with overall market sentiment to make sure your trade setup is solid.
Customization Options in Crypto Trading Charts

Giving a personal touch to your crypto chart turns plain market numbers into a handy tool, letting you design strategies with better precision. Many traders use simple drawing tools to highlight key areas by joining significant highs and lows. Imagine drawing a line between two big peaks, it can quickly show a rising trend. I recall a time when a chart, marked by a line connecting two high points, uncovered a hidden channel that hinted it was time to exit.
You can also use these tools to mark parallel highs and lows and create price channels. This approach clearly outlines how prices move and can even reveal when a breakout is on the horizon. Try out different overlay drawing techniques to zero in on where support and resistance might shift dynamically.
Another smart option is the Fibonacci retracement guide. By setting key levels at 23.6%, 38.2%, and 61.8%, you can spot zones likely to hold a pullback or offer resistance. For instance, when these levels appear on your chart, they might signal that a small dip could soon flip into an uptrend.
- Use drawing tools to sketch trend lines and see price channels.
- Use Fibonacci retracement levels to spot potential support and resistance.
These tweaks let you customize your charts, paving the way for more confident trades based on clear, visual insights.
Platform Evaluation Reviews for Crypto Trading Charts
A lot of exchanges offer simple chart tools to help you follow price jumps in real time, but when you need a deeper look at the market, platforms like TradingView really stand out. They let you view multiple time frames at once so you can catch both tiny details and the bigger trend. One trader said, "When I saw the multi-view dashboard on TradingView during a sudden dip, I immediately picked up the pattern and shifted my position."
We often judge trading platforms on a few key points. First, take a good look at the user interface, is it clean and easy to use? A well-laid-out design makes it simple to adjust charts, draw support and resistance lines, and switch between indicators. For example, if a platform has drag-and-drop features, you can easily swap between candlestick and line charts to get just the right market view.
Next, device compatibility is a big deal. Desktop software usually comes with a full set of technical tools and drawing options for deeper analysis. And when you’re on the move, mobile chart tools extend these benefits, letting you keep an eye on your trades and spot trends wherever you go. Features like customizable alerts and various indicator overlays can really help you fine-tune your trading strategy in real time.
| Evaluation Criteria |
|---|
| Intuitive interface and easy navigation |
| Multi-device compatibility: desktop and mobile |
| Wide range of indicators with reliable real-time updates |
Traders appreciate platforms that combine strong performance with a smooth, accessible experience, whether they’re at home or trading on the go.
Final Words
In the action, we explored real-time platforms that bring clarity to crypto trading charts. The article reviewed chart types, key technical indicators, candlestick patterns, and volume analysis techniques while highlighting options for custom setups. We also compared various platform experiences to guide smarter investment decisions. This discussion leaves you well-prepared to interpret live market data in a way that builds confidence. Keep an open mind and embrace the insights from your crypto trading charts as you make your next smart move.
FAQ
What free crypto trading charts are available?
Free crypto trading charts show live market data and price trends, letting you track cryptocurrency movements with basic tools that suit casual traders seeking a quick snapshot of the market.
What are the best crypto trading charts available?
The best crypto charts offer real-time data, multiple technical indicators, and user-friendly interfaces. Many traders favor platforms like TradingView for in-depth market analysis and personalized chart setups.
What are the best live crypto charts with indicators?
The best live crypto charts display second-by-second pricing along with technical indicators, allowing traders to monitor shifts and trends using interactive tools on platforms such as TradingView.
Which chart is best for crypto trading?
The optimal crypto chart depends on your trading style, with many preferring interactive candlestick views combined with volume and technical indicators to guide informed trading decisions.
Can you really make $100 a day with crypto trading?
Making $100 a day with crypto is possible through disciplined strategies and real-time data monitoring, though it requires skill, careful planning, and an understanding that trading always carries risk.
Which crypto is good for trading right now?
The best crypto for trading depends on current trends, liquidity, and volatility. Reviewing real-time data and technical analysis helps you select assets that align with your trading goals.
How is the crypto market right now?
The crypto market’s status can be gauged by checking live price feeds, volume data, and sentiment indicators from trusted charts, offering a current view of market trends and activity.
What do platforms like Coinbase, Binance, Bybit, OKX, Bitget, and Uniswap offer?
These trading platforms provide secure exchanges, live data charts, and various analytical tools, ensuring both beginners and experienced traders have access to reliable market insights.
What does TradingView offer for crypto traders?
TradingView delivers an interactive charting experience with real-time data, a wide range of technical indicators, and customizable analysis tools that help traders make data-driven decisions.

