Ever thought that clues hidden in old price charts might hint at an altcoin surge? Market analysis isn’t about wild guesses, it's about mixing two proven methods to make sense of the numbers.
First, you check out project details like white papers (official documents that explain a project's plan) and the strength of its leadership. Next, you look at charts to spot patterns and momentum (the speed and direction of price movements).
By combining these approaches, you cut through the clutter and spot real opportunities. This guide offers a clear, step-by-step way to evaluate altcoins so you can stay ahead of the game.
Step-by-Step Guide to Analyzing Altcoin Market Trends

Start your analysis by using two different approaches that work well together. Begin by gathering all the relevant data, like past prices and trading volumes, and jot it down on a checklist. For a fun starter, remember that before digital finance became a big deal, many investors missed the hidden hints in everyday market data. This little reminder shows that every detail truly counts.
Let's kick off with fundamental analysis. Begin by checking out the project's white paper so you can understand its goals and plans. Look into the people behind the altcoin, see what their past achievements are and how strong their leadership seems. Take a close look at the roadmap to make sure the project’s milestones and timelines are clear. Also, review the tokenomics (for example, the coin's supply, how it's shared, and its circulation) to gauge how stable the coin might be and how it could behave in the market.
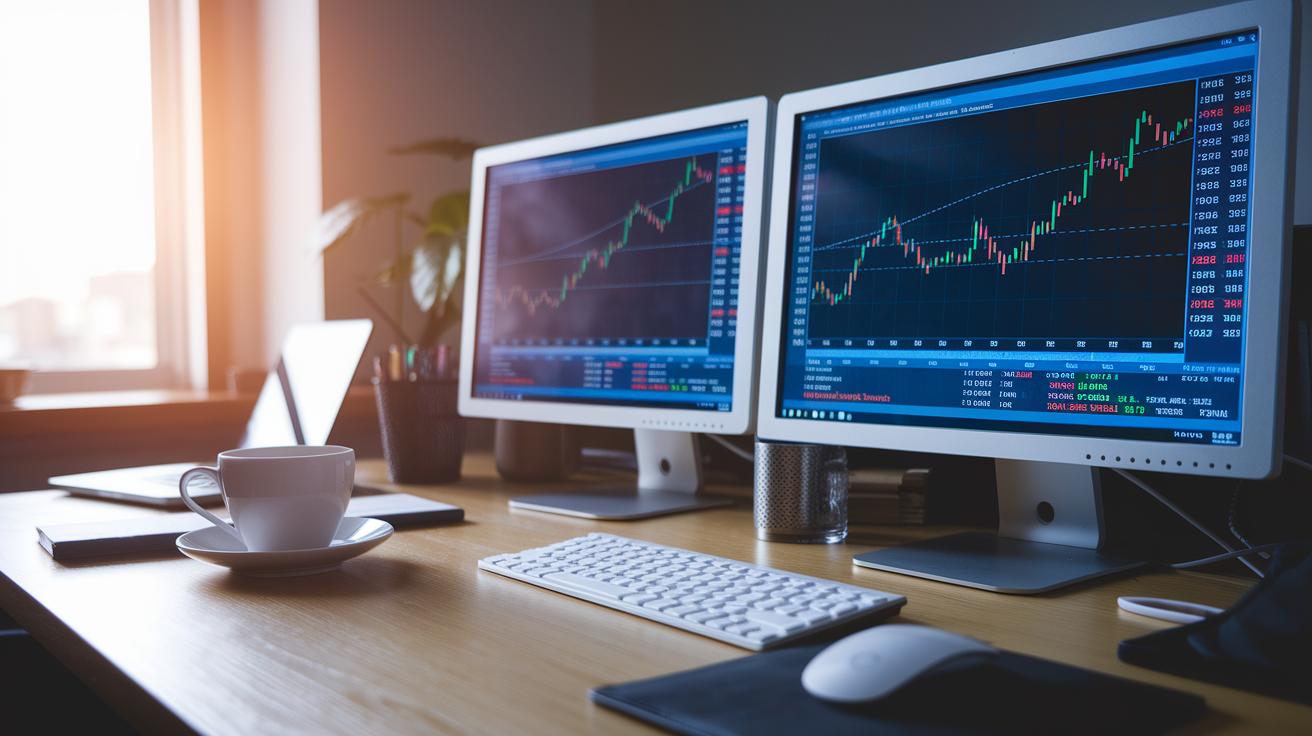
Then, move on to technical analysis. This means you’ll study historical price and volume data. Look for patterns in the charts that might hint at recurring trends. Use tools like moving averages, which help smooth out sudden price jumps, and consider momentum indicators (like relative strength, a measure of how fast prices change) to catch shifts that might indicate price changes ahead.
Put these approaches together for a well-rounded view by following these clear steps:
- Check the white paper and learn about the team’s background.
- Gather and clean up historical price and volume data.
- Spot chart patterns, watch for breakouts, and note any shifts in momentum.
- Regularly keep an eye on the roadmap and tokenomics details.
By blending fundamental and technical analysis, you get a full picture of altcoin market trends. This hands-on approach lets you make smart decisions by carefully checking both market data and project details, giving you a practical way to evaluate and predict altcoin performance.
Sourcing and Preparing Altcoin Market Data for Trend Forecasting

First off, you want to gather steady time-series data on both price and volume. Think of it as collecting a clear history of how prices moved over many market ups and downs. When you look at altcoin data, consider things like how many tokens are out there and how marketing pushes can sway prices. For example, did you know that even before altcoins became wildly popular, early charts were already hinting at big changes that many folks overlooked?
Next, find solid exchanges or public datasets that offer detailed records. Once you have the data, invest some time in cleaning it up, removing mistakes, filling in gaps, and making sure everything matches up nicely. Without well-organized data, even the best forecasting tools can give you shaky results.
One easy way to keep your data tidy is to set it up in clear fields. For instance:
| Date | Price | Volume |
|---|---|---|
| 2023-01-01 | $0.50 | 1500 |
| 2023-01-02 | $0.55 | 1600 |
When your datasets are clear and organized, they lay the foundation for trustworthy trend forecasting and solid altcoin evaluations.
Technical Analysis Techniques for Altcoin Price Dynamics

Technical analysis is all about digging into past price and volume records to spot clues for future trends. Remember how early traders used handwritten charts? Their simple sketches paved the way to the digital models we see today.
When you look at price charts, familiar shapes can suggest if a trend might reverse or keep going. For instance, if prices break out with heavy volume, that’s often a sign a new trend is kicking off. It’s like catching a whisper in the data that says, "Something’s happening here!"
Moving averages help smooth out price bumps so you can see the main trend more clearly. When a short-term moving average crosses above a long-term one, it might be a hint that prices are on the rise. Keeping an eye on changes in the slope and volume can back up that idea.
Momentum tools, like the relative strength index (which measures how fast prices are moving), add another layer of insight into what’s really going on.
- Check chart patterns to spot possible trend reversals.
- Look for breakout moves confirmed by strong volume.
- Use moving averages to smooth out data and reveal clearer trends.
- Lean on momentum indicators to measure the pace of price changes.
Mixing these techniques together creates a practical toolkit for understanding altcoin price movements. It bridges a bit of history with modern insights, making technical analysis feel like a friendly, down-to-earth chat about the markets.
Fundamental Analysis Framework for Emerging Altcoin Movements

Begin by reading the altcoin's white paper, it’s like peeking into the project’s blueprint. The white paper explains the vision and details how the token supply might adjust when more people get on board. For example, it might say, "We will periodically decrease token issuance as volume increases," hinting that the price could remain steady as interest grows.
Next, take a moment to learn about the team behind the project. A group with a solid track record and previous wins can really boost your confidence in the new endeavor. It’s like knowing your friends have succeeded before, they naturally make you trust the process.
Then, check out the roadmap that outlines planned milestones. A clear timeline, maybe starting with minor tweaks and moving to a major network upgrade later in the year, shows you what progress to expect. It’s a straightforward way to see the project’s future plans.
Also, dive into the tokenomics. This means looking at how the supply, distribution, and overall circulation are managed. When these elements are balanced, it’s a good sign the project might hold strong in the long run.
Emerging Altcoin Specifics
For emerging altcoins, extra attention is given to unique adjustments in token supply and fresh financial strategies. For instance, a project may detail, "The protocol adapts token burn rates based on user demand," giving you a neat glimpse into how market factors influence token behavior.
• Check the white paper for clear, adaptable project goals.
• Look into the team’s background to gauge credibility.
• Review the roadmap to understand what milestones are planned.
• Evaluate tokenomics, focusing on supply mechanisms, distribution, and circulation.
Integrating Technical and Fundamental Signals for Strategic Altcoin Trade Timing
Mixing technical and fundamental signals gives you a reliable way to time your altcoin trades. This strategy pairs chart insights with a careful look at a project’s inner strengths. For instance, if you spot a moving average crossover along with a good update in tokenomics (the basic rules that govern a token’s use), it might signal a robust trend shift.
Start by looking at the technical side. Keep an eye out for breakout patterns where the price jumps past a resistance level with high volume, a hint that a significant move might be coming. Moving average overlays smooth out short-term noise, helping you see the true trend clearly.
At the same time, check the fundamentals. Look into details such as progress on the project’s roadmap, team updates, and any changes in token supply. A new partnership or upgrade can often mean a smarter token issuance schedule, which may lead to better price stability. In other words, technical signals can act as early alerts, while the fundamentals back those signals with long-term value.
- Watch for chart patterns like big volume surges and moving average crossovers.
- Confirm these with real updates in tokenomics and roadmap milestones.
- Use clear data to compare past performance with current developments.
By combining both technical and fundamental analysis, you’re better equipped to decide when to jump in or exit during the ups and downs of altcoin markets. It’s a thoughtful blend of data-driven signals and practical project insights that leads to smarter trade timing and a deeper understanding of market trends.
Case Study: Applying Price Chart Assessment to Altcoin Trend Analysis

Imagine tracking an altcoin that clearly shows up-and-down moves over time. We followed altcoin X for several months, and its price chart looked like a roller coaster, with easy-to-spot peaks and dips that show how prices can shift around. One exciting moment came when a sudden burst in trading volume lined up with a jump in price, almost like a green light telling us the trend might continue.
When you study the data, you start by noticing times when prices hover near a tough resistance level before finally breaking through. Years ago, before screens were the go-to for trading, folks used printed charts and tracked volumes by hand, yet even back then, they could see the same kinds of patterns we observe today.
To really understand these cycles, you need to look at many points in time. For a clear overview, you could put key dates, prices, and volumes into a table:
| Date | Price | Volume |
|---|---|---|
| 2023-02-15 | $0.75 | 2000 |
| 2023-03-10 | $0.90 | 3500 |
Looking at these figures makes it easier to see the recurring ups and downs and confirms that breakout moments really matter. In truth, by breaking down historical price moves and volume changes, you can spot practical hints that help forecast trends in blockchain markets.
Essential Tools and Resources for Altcoin Evaluation
Using the right platforms can really kickstart your understanding of market sentiment in altcoin markets. These day-to-day tools grab high-frequency data, which means they capture market moves fast, and mix that with other insights to give you a clear view of price shifts. Just think about a tool that refreshes your price charts every few seconds; it's like watching your favorite sports game live and catching every exciting play.
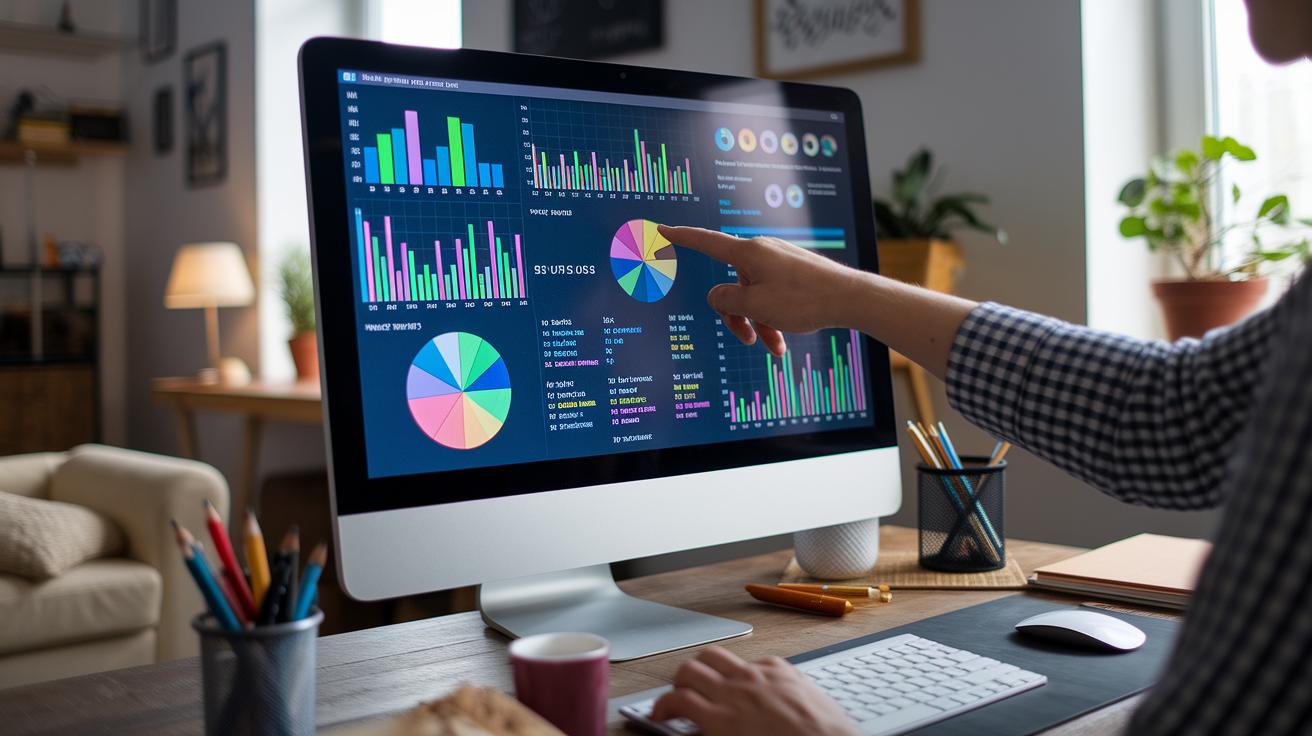
Data visualization tools help by turning big, complex data sets into simple clusters you can see in an instant. Picture a dashboard that neatly groups similar market happenings so that trends don’t hide in the background, but instead jump right out at you.
And there are analytics platforms, too, that provide solid, real-time numbers on token performance. They show you both price changes and volume spikes side by side, painting a clear picture of market mood. You can explore market data aggregators, use data clustering tools for spotting patterns, and rely on these analytic resources to keep your trend measurements unbiased.
Final Words
In the action, we broke down the key steps of altcoin market evaluation. We covered both fundamental parts like white paper reviews and tokenomics, and technical parts using price patterns and momentum metrics. This guide showed you how to analyze altcoin market trends by merging these techniques into one actionable framework. We hope these insights make complex market shifts easier to understand and help you make confident decisions when scouting the altcoin scene. Stay curious and keep exploring, you’re on a great path forward.
FAQ
How do you analyze altcoin market trends and crypto market data?
Analyzing altcoin market trends means looking at historical price and volume data and using technical charts to spot patterns and potential breakouts, while also checking community insights from forums like Reddit.
How do you spot crypto trends and know which crypto will go up?
Spotting crypto trends involves reviewing price movements, volume shifts, and technical indicators to identify momentum, which helps predict which cryptocurrencies might experience upward movements.
How do you perform crypto fundamental analysis using various resources?
Crypto fundamental analysis evaluates a project’s white paper, vision, team, and tokenomics, and relies on specialized websites and PDFs to assess an asset’s underlying value beyond just market trends.
What platforms can be used for comprehensive cryptocurrency analysis?
Recommended platforms include Gecko Labs, Coinbase, Binance, and Messari. They offer real-time data, technical chart tools, and detailed fundamental insights to help you make informed investment decisions.

