Have you ever wondered if your altcoin investments are really as safe as they appear? Liquidity can make a huge difference by shielding your trades from sudden bumps in coin prices. In this guide, we break down simple signals like trading volume, which shows how many coins are being traded and indicates market interest, and bid-ask spreads, which reveal the gap between what buyers are ready to pay and the prices sellers set. By grasping these basic hints, you'll feel more confident about your investment moves. A clear understanding of liquidity helps you build a smarter, more secure trading strategy.
Altcoin Liquidity Analysis: Core Concepts and Essential Metrics
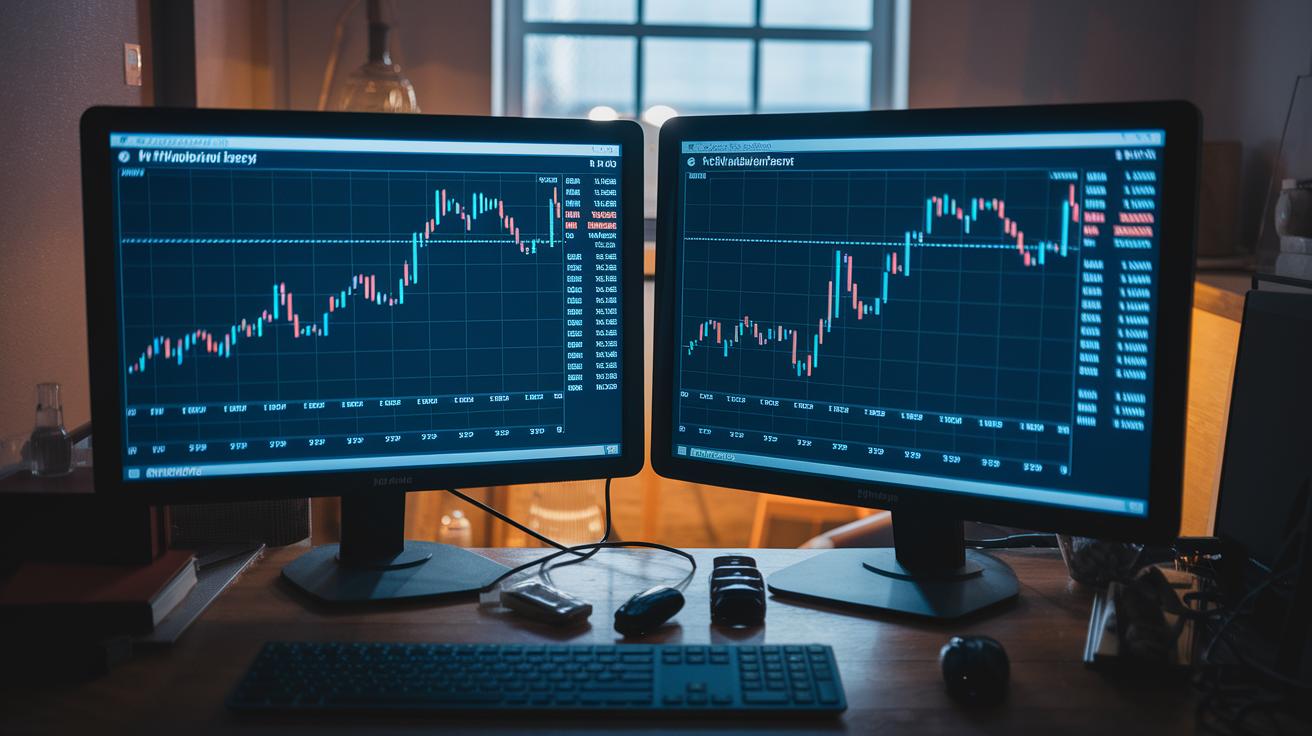
When it comes to investing smartly in altcoins, liquidity really makes the difference. In a market that can shift in seconds, keeping an eye on trading volume and liquidity gives you a quick look at how busy and active things are. For example, if there’s high trading volume, it means lots of people are buying and selling. This makes it easier for you to trade altcoins without big price bumps.
It’s important to understand these liquidity numbers, especially in a market known for sudden changes. Simple tools, like looking at the bid-ask spread (the gap between the price people want to pay and the price sellers ask for), checking market depth (the total size of orders at various prices), and knowing the market capitalization (the overall value calculated by multiplying an altcoin's price by its available supply), help you see what’s really happening. Think of it like checking the pulse of a business, you get a real feel for its strength by looking at key figures.
| Metric | Definition | Importance |
|---|---|---|
| Trading Volume | Total transacted amount over a set period | Shows how active the market is and gauges investor interest |
| Bid-Ask Spread | The difference between the highest bid and the lowest ask | Indicates market efficiency and potential trading costs |
| Market Depth | Sum of orders available at different price levels | Helps you see how much the price might change with big trades |
| Turnover Ratio | Measure of volume in relation to market capitalization | Shows if the liquidity matches the overall size of the market |
| Market Capitalization | Current price multiplied by the number of coins in circulation | Gives a snapshot of a coin’s overall strength and appeal |
Looking at these numbers together gives you a full picture of an altcoin's liquidity. By comparing trading volume with bid-ask spreads and market depth, you can figure out both how lively the market is and where the risks might be. The turnover ratio adds a layer of context to see if the liquidity is in line with the market’s size, while market capitalization hints at how strong or popular an altcoin might be. All these clues work together to help you make smart, informed decisions about trading altcoins.
Altcoin Liquidity Data Sources: Where to Find Reliable Market Information

Centralized exchanges are where you'll often start when hunting for altcoin liquidity insights. They provide up-to-date data on prices, trading volumes, and even past trends, giving you a clear picture of what’s happening right now. By checking these platforms regularly, you can quickly spot any sudden changes in liquidity and get a feel for the overall market vibe.
Social media sites like Twitter and Reddit also give you a glimpse into investor mood and market sentiment. Sure, these channels offer quick impressions, but it's a good idea to cross-check them with solid data from blockchain records and price feeds. Mixing both the chatter and hard facts makes your liquidity analysis much stronger and helps you catch those early warning signs when market shifts begin to occur.
And let’s not forget the outside factors. Changes in government regulations or tech upgrades, like shifting to a Proof-of-Stake system (which means network users help secure the blockchain), can really change trading patterns and investor feelings. These factors impact liquidity by not only altering market rules but also by changing how efficiently a network runs. Keeping an eye on these developments gives you a well-rounded understanding of altcoin market health.
Altcoin Order Book Depth Analysis: Step-by-Step Process
Understanding the order book depth is key to reading market sentiment and planning your trades. It shows where orders build up and how big deals might shift the price from its current level.
First, connect to the exchange API. This step means linking to the exchange’s system so you can securely fetch real-time data.
Next, grab the live order book data. You’ll pull the current buy and sell orders directly from the market to see an up-to-the-minute snapshot.
Then, check out the bid-ask spread. This is the difference between the highest price someone is willing to pay and the lowest price a seller will accept. It gives you a quick idea of the cost of trading immediately.
After that, measure the depth at several price levels. Look at how many orders sit at different price points to see how well the market might handle large trades.
Also, compute the average trade size. Knowing the typical transaction size helps you understand everyday market behavior.
Finally, assess how large orders might affect the price. Imagine placing a big order against the current book. This helps you predict price shifts, especially when you pair these insights with extra technical indicators like moving averages, RSI, or Bollinger Bands. Ever notice how a sudden gap in order depth can make the market feel a bit like a sudden weather change?
Don’t overlook how order book data and technical analysis work together. Traders might ignore how a gap in order depth can boost volatility, particularly when technical signals confirm a change in momentum. So, take your time, check your data carefully, and blend these insights with broader market trends to keep your strategy balanced and informed.
Altcoin Trading Volume and Market Depth: Measuring Liquidity Dynamics

Trading volume shows how many trades happened over a set time, giving you a clear glimpse of market activity. It counts how many altcoins are being swapped, so if you see a sudden jump, it might mean more traders are jumping in because of new news or trends.
Market depth, on the other hand, stacks up all the pending buy and sell orders at different price points. This tells you how far an altcoin’s price might move if a big trade comes in. A deep market means the price is less likely to get shaken by a single, large order.
Mixing these two gives a full picture of liquidity. For instance, looking at time-weighted average volume over both short and long periods can help spot sudden changes. Then, by comparing these numbers with historical data, you can catch emerging risks early. This approach helps investors read market conditions better and adjust their strategies for quicker, smarter trading moves.
Altcoin Liquidity Analysis Tools and Platforms: A Review
When you're diving into altcoin liquidity, think of market data aggregators, on-chain analytics platforms, and trading interfaces as your go-to guides. They offer live snapshots and a look back at historical trends, making it easier to understand market movements and investor behavior.
Each tool type shines in its own way. Data platforms update you with simple numbers about prices, volumes, and order book depth (which tells you how many orders are lined up). On-chain tools, meanwhile, share historical trends and transaction flows that bring past market actions into view. And trading interfaces? They let you play with customizable dashboards that highlight technical insights, giving you a clear signal for smart decision-making.
Take market data aggregators like CoinMarketCap and CoinGecko. They send you real-time updates on altcoin prices, trading volumes, and liquidity details. Then, on-chain analytics platforms such as Glassnode and Dune Analytics step in with a deep dive into historical data, helping you see the full story behind market performance. Together, they create a multi-layered look at market conditions that helps you balance risk and spot potential rewards.
Trading interfaces such as TradingView enhance this setup even further. With user-friendly designs and plugins focused on liquidity, they make it easier to track sudden market shifts. Their clear dashboards often hint at good entry or exit points, supporting a strategy that's both informed and self-driven.
Altcoin Liquidity Analysis Case Studies: Practical Examples
When you dive into real market data, you get a clear view of how market trends and risks play out. By checking out concrete examples, you see firsthand how different trading environments affect liquidity and, in turn, your trading plan.
Take Ethereum for example. Over a 24-hour period, it trades around $30 billion. You also notice a very tight price gap between buying and selling, around 0.02%, which means costs stay low. The order book shows extra support at plus or minus 1% from the current price, acting like a cushion to keep sudden price moves in check. Often, orders line up close to today’s price, keeping liquidity strong and helping large trades go through smoothly without big price gaps.
Now, compare that to a smaller token we’ll call MicrocapToken. Here, the daily trading volume is only about $5 million, and the price gap jumps to roughly 1.5%. The order book isn’t as deep, so there’s a higher risk of price slips. This is a common challenge with small-cap altcoins, where you must carefully weigh the risks when trading assets with limited liquidity and more volatile swings.
What do these examples teach us? They highlight the importance of using liquidity metrics in planning your investments. Understanding whether an order book is deep or thin helps you decide on the best times to enter or exit a trade. By keeping an eye on liquidity, you can manage your investments with a more balanced and thoughtful approach.
Altcoin Liquidity Metrics for Risk Management and Trading Strategy
Altcoin trading can be risky if you jump in too fast without doing your homework or setting up protective stop-loss orders. FOMO trades can trap you into holding too much, making it harder to adapt when the market changes quickly. Even small oversights, like not checking liquidity metrics (a measure of how easily you can buy or sell an asset), can add up to bigger losses over time.
Using risk management tools that focus on liquidity metrics can really help shield your investments. For example, setting stop-loss levels based on the bid-ask spread (the difference between what buyers pay and what sellers ask) and market depth can protect you from sharp price drops. Plus, mixing in altcoins with high liquidity adds a safety cushion against wild swings. This kind of automated, data-driven risk check is a smart way to keep your trading plan secure.
By weaving liquidity signals into your strategy for entering and exiting trades, you also reduce slippage (the difference between expected and actual trade prices) and better take advantage of fast market moves. Keeping a close eye on market depth and trading volume allows you to pick entry points that dodge bad fills and exit tactics that lock in profits. This balanced approach helps you make trades that are adjusted for risk, leading to steadier results overall.
Final Words
In the action, we broke down the essential methods for understanding altcoin liquidity, covering core metrics, reliable data sources, order book depth, and market dynamics. We also shared practical cases and outlined risk management tools to help manage trading decisions. This altcoin liquidity analysis guide emphasized clear steps, real-life examples, and strategic tips that simplify complex market trends into actionable insights. The discussion leaves you empowered to assess market conditions and act confidently, setting the stage for smart and adaptable investment strategies.
FAQ
How to check liquidity of a crypto?
Checking crypto liquidity means examining trading volume, order book depth, and bid-ask spread data from trusted exchanges. This measurement shows how easily you can buy or sell the asset under normal market conditions.
What do cryptocurrency liquidity charts, Bitcoin liquidity charts, and liquidity heatmaps show?
These charts and heatmaps display key liquidity metrics such as trading volume and order book depth. They help you visualize market activity and detect potential price impact areas when placing larger orders.
How to calculate liquidity in crypto?
Calculating liquidity involves evaluating trading volume, market depth, and bid-ask spread. By combining these metrics, you can estimate how quickly an asset can be traded without dramatically affecting its market price.
What is a cryptocurrency liquidity problem?
A liquidity problem in crypto occurs when low trading volume or limited order book depth causes significant price swings. This makes it challenging to execute sizable trades without affecting the asset’s price.
What is considered good liquidity in crypto?
Good liquidity in crypto means strong trading volume and deep order books. This ensures that assets can be traded quickly with minimal price changes, giving traders more confidence during volatile market conditions.
What is a Liquidity Checker?
A liquidity checker is a tool that compiles real-time market data to display liquidity metrics. It allows you to quickly assess trading conditions and make informed decisions about entering or exiting positions.

